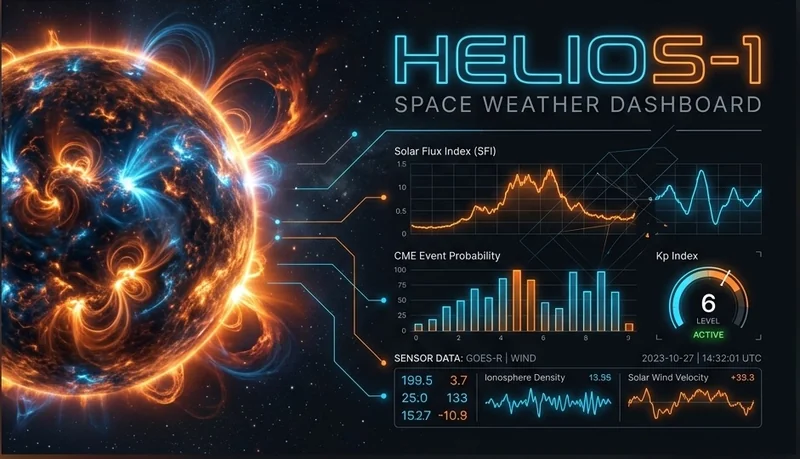
Space weather telemetry—such as geomagnetic storm indexes (Kp Index), solar flare flux (SFI), and Coronal
Mass Ejection (CME) probabilities—is dense and difficult for high school students to interpret in raw data
formats. The client required an intuitive, interactive dashboard that turns complex real-time satellite
streams into actionable, educational insights.
The Solution & Technical Highlights
Real-Time Data Pipelines
Integrated live data ingestion from NOAA SWPC and NASA telemetry feeds, parsing high-frequency sensor
readings into accessible, interactive data visualizers.
AI-Powered Space Weather Briefs
Implemented an automated LLM analyst pipeline that digests multi-source telemetry data every 30
minutes to output plain-English situational reports and activity summaries.
Student-Focused Interactive UI
Designed dynamic charts and risk-level indicators (Kp 1–9) tailored for interactive classroom
demonstrations, data exploration, and solar event forecasting.
Optimized Performance & Caching
Implemented server-side caching and streaming responses to ensure low-latency data rendering and
minimal API overhead.
Key Outcomes & Impact
Successfully deployed to cloud server for science club to support astronomy and physics curriculum
modules.
Reduced student data interpretation time by transforming raw tabular feeds into natural language
summaries alongside real-time visual telemetry.